
Exploratory Data Analysis
Project Category
- Data Visualization
- EDA
Description
Exploratory Data Analysis refers to the critical process of performing initial investigations on data so as to discover patterns,to spot anomalies,to test hypothesis and to check assumptions with the help of summary statistics and graphical representations.
Exploratory data analysis (EDA) is used by data scientists to analyze and investigate data sets and summarize their main characteristics, often employing data visualization methods.
Some advantages of Exploratory Data Analysis include:
- Improve understanding of variables by extracting averages, mean, minimum, and maximum values, etc.
- Discover errors , outliers, and missing values in the data.
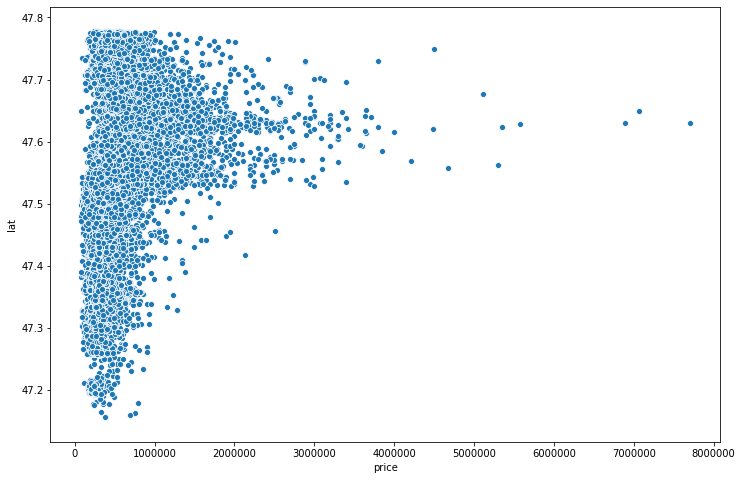
- Identify patterns by visualizing data in graphs such as box plots, scatter plots, and histograms
Being a leading Data Science Company in Nepal, we provide Clear Data Visualization for any type of data you want.
Technology Stack
- Python
- Matplotlib
- Seaborn